Yes, you can determine if your child's weight is healthy using our BMI percentile calculator for ages 2‑20. Enter height and weight to see the exact percentile and get guidance.
By Shubhra Mishra — a mom of two who turned her own confusion during pregnancy into BumpBites, a global mission to make food choices clear, safe, and stress-free for every expecting mother. 💛
Check whether any food is safe during pregnancy with the BumpBites Food Safety Checker.
Here’s the expanded, complete article in HTML—now ~3,600 words with added depth, new sections, practical detail, and two additional FAQs. Every existing element is preserved, and the voice remains warm, authoritative, and reassuring.
---
Quick take: You can tell if your child’s weight is healthy by calculating their BMI and then seeing where that number falls on age‑ and sex‑specific growth charts. A percentile between the 5th and 85th is generally considered a healthy range; values below or above signal underweight or excess weight, and a pediatrician can help you interpret the result. Remember, BMI percentiles are a starting point, not a final verdict—growth trends and overall health matter just as much as the number itself.
It’s 7 a.m., you’ve just finished a quick breakfast with your 7‑year‑old, and a cartoon on the TV shows the kid’s favorite hero “growing up strong.” A few minutes later, a school nurse asks you to fill out a form that asks for your child’s height, weight, and age. A wave of anxiety hits you—“Is my child’s weight healthy?” you wonder. You’re not alone; many parents feel the same knot in their stomach when a number pops up on a growth chart.
🔢 Calculate it for your situation: Use our Child BMI Calculator for a personalized result in seconds.
First, breathe. The tools we use to assess a child’s weight are different from the adult BMI you might have heard about in a fitness article. Pediatric BMI is turned into a percentile that compares your child to millions of peers of the same sex and age. That percentile tells you whether your child is underweight, in a healthy range, overweight, or in the obesity category. But it’s not just about the number—it’s about the story behind it. Is your child active and energetic? Do they eat a variety of foods? Are they growing steadily, even if they’re not in the “average” range?
In this guide we’ll walk through everything you need to know: what BMI percentiles are, how to calculate them, how to read the results, what factors can shift those numbers, and what steps to take if the chart says “outside the healthy range.” We’ll also cover how to track growth over time, how to talk to your child about weight in a positive way, and when to seek professional help. By the end you’ll feel confident using a Child BMI Calculator, interpreting the output, and having an informed conversation with your pediatrician.
What is BMI and why do kids use percentiles?
Body Mass Index (BMI) is a simple formula that relates a person’s weight to their height: weight (kg) ÷ height (m)². For adults, the resulting number is compared to fixed thresholds—under 18.5 is underweight, 18.5‑24.9 is healthy, 25‑29.9 is overweight, and 30 + is obese. Those cut‑offs work because adult bodies have relatively stable composition after the early twenties.
Children, however, are constantly growing, and their bodies change shape as they move through puberty. A 10‑year‑old boy who is 5 ft 2 in and weighs 85 lb will have a very different body composition than a 10‑year‑old girl of the same height and weight. Because of those differences, a single BMI number isn’t useful on its own. Instead, the CDC and WHO plot each child’s BMI on a growth chart that accounts for age and sex. The chart then tells you what percentile the BMI falls into compared with a reference population of peers.
Think of the percentile as a rank in a race. If your child’s BMI is at the 60th percentile, it means 60 % of children the same age and sex have a lower BMI, and 40 % have a higher one. This relative measure lets clinicians see whether a child is tracking along a typical growth curve or veering toward the extremes. But here’s the key: the percentile isn’t a grade. It’s a tool to help you and your pediatrician understand how your child’s growth compares to others their age, not whether they’re “failing” or “passing.”
Why does the chart matter? Because children’s “healthy” BMI ranges shift as they grow. A BMI of 18 can be perfectly normal for a 2‑year‑old but may be low for a teenager. By anchoring the number to a percentile, we get a dynamic, age‑specific standard that reflects the natural changes of growth. For example, a child who is at the 75th percentile at age 5 and stays at the 75th percentile at age 10 is growing consistently—even if their raw BMI number increases. That’s what clinicians call “tracking along the curve,” and it’s a sign of healthy development.
It’s also worth noting that the growth charts used in the U.S. (CDC) and internationally (WHO) are slightly different. The CDC charts are based on U.S. children from the 1960s to 1990s, while the WHO charts reflect a multinational study of children raised in optimal health environments. Both are valid, but your pediatrician may prefer one over the other depending on your child’s background. For most families in the U.S., the CDC charts are the standard.
How to calculate your child's BMI step‑by‑step
Befor
e you can place your child on a growth chart, you need the raw BMI number. Here’s the straightforward formula and the data you’ll need.
Gather the measurements. You’ll need your child’s weight in kilograms (or pounds) and height in meters (or inches). For most U.S. families, weight is recorded in pounds and height in inches, so we’ll give both conversion factors. For the most accurate result, measure weight without shoes or heavy clothing, and measure height against a flat wall using a stadiometer or a book and a tape measure. If you’re using a home scale, try to weigh your child at the same time of day—morning, after using the bathroom but before breakfast, is ideal.
Convert to metric (if needed). Divide pounds by 2.2046 to get kilograms. Divide inches by 39.37 to get meters. Example: 45 lb ÷ 2.2046 ≈ 20.4 kg; 48 in ÷ 39.37 ≈ 1.22 m. If you’re not comfortable with conversions, don’t worry—most online calculators let you input pounds and inches directly and handle the math for you.
Apply the BMI formula. BMI = weight (kg) ÷ [height (m)]². Using the example above: 20.4 ÷ (1.22 × 1.22) ≈ 13.7. This number is your child’s raw BMI. It’s not a percentile yet—just a starting point.
Round to one decimal place. Most growth charts and calculators accept a single‑decimal BMI, so 13.7 is ready for the next step. If you’re doing the math by hand, rounding makes it easier to plot on a paper chart.
Record your child’s exact age. Age is expressed in years and months (e.g., 5 years 6 months). The more precise the age, the more accurate the percentile. For example, a child who is 5 years and 11 months old will have a slightly different percentile than a child who is 5 years and 1 month old, even if their BMI is the same. If you’re not sure of the exact month, use the closest whole year—just know that the result may be slightly less precise.
That’s it—you now have a numeric BMI. The next step is to translate that number into a percentile using a chart or an online calculator. The calculation itself is quick, but the interpretation is where the nuance lies. For example, a BMI of 16 might be at the 50th percentile for a 4-year-old but at the 90th percentile for a 2-year-old. That’s why the age and sex adjustment is so important.
If you’re measuring at home, keep a few tips in mind. First, use the same scale and measuring tools each time to ensure consistency. Second, try to measure at the same time of day—morning weights tend to be lower than evening weights. Third, if your child is sick or has had a big meal, wait a day or two before measuring. Finally, if your child is very active or has a lot of muscle, their BMI might be higher than average, but that doesn’t necessarily mean they’re overweight. That’s why it’s important to look at the whole picture, not just the number.
Using a BMI percentile calculator (and why you might prefer an online tool)
Manual lookup on a printed CDC growth chart can feel like solving a puzzle, especially if you’re not used to reading percentile curves. An online calculator does the heavy lifting: you input age, sex, height, and weight, and it instantly returns the percentile. But not all calculators are created equal—some are more user-friendly than others, and some offer extra features that can be helpful for tracking growth over time.
When you visit a reputable calculator, you’ll usually see fields for:
Age (years and months)
Sex (male or female)
Height (inches or centimeters)
Weight (pounds or kilograms)
After you hit “calculate,” the tool shows the BMI number, the percentile, and often a color‑coded category (green for healthy weight, yellow for overweight, red for obesity). Some calculators, like the Child BMI Calculator, also let you save the result to track trends over time. This is especially useful if you’re monitoring your child’s growth between pediatric visits. You can create a simple growth log by recording the date, BMI, and percentile each time you measure. Over months or years, this log can help you and your pediatrician spot trends—like a gradual increase in percentile—that might not be obvious from a single measurement.
If you prefer a paper‑based method, you can locate the CDC BMI-for‑age chart for your child’s sex, find the exact height on the vertical axis, then follow the horizontal line that corresponds to the BMI you calculated. Where the two lines intersect is your child’s percentile. It takes a few minutes the first time, but many families keep a printed copy in a family health binder for quick reference. You can download the charts for free from the CDC website—they come in both metric and imperial versions, so you can choose the one that’s easiest for you.
One advantage of paper charts is that they let you see the “curves” of growth. For example, you might notice that your child’s BMI has been slowly increasing but is still following the same curve as before. This is a sign of healthy growth, even if the percentile is higher than average. On the other hand, if the BMI jumps suddenly off the curve, it might be a sign that something has changed—like a new activity level or a shift in diet. Either way, the paper chart gives you a visual way to track progress over time.
Whether you use an online calculator or a paper chart, the key is consistency. Measure at the same time of day, using the same tools, and record the results in the same way each time. This will give you the most accurate picture of your child’s growth.
What the percentile numbers mean: categories and cut‑offs
Once you have the percentile, you can place your child into one of four standard categories. The CDC defines them as follows:
Percentile range
Weight category
Typical interpretation
Less than 5th
Underweight
Potential risk for nutrient deficiencies; consider evaluation.
5th – 84th
Healthy weight
Within the normal growth range; continue balanced diet and activity.
85th – 94th
Overweight
Higher risk for future weight‑related issues; monitor diet and activity.
95th and above
Obesity
Increased risk for hypertension, diabetes, and other conditions; professional guidance advised.
These cut‑offs are not rigid diagnoses; they are screening tools. A child at the 86th percentile is technically “overweight,” but many factors—muscle mass, genetics, and even recent growth spurts—can influence the number. The key is to look at trends. If the percentile is creeping upward over several months, it may signal a need for lifestyle adjustments. For example, a child who moves from the 75th to the 85th percentile over a year might benefit from more active play or smaller portion sizes, but they don’t necessarily need a dramatic intervention.
For adolescents, the same percentiles apply, but puberty can cause rapid shifts. A teen who jumps from the 60th to the 90th percentile within a year may be experiencing a growth spurt combined with increased muscle or fat mass. That’s why clinicians often repeat measurements every six months during puberty. It’s also why the American Academy of Pediatrics (AAP) recommends that pediatricians use BMI percentiles as part of a broader assessment, not as the sole indicator of health. Other factors—like blood pressure, cholesterol levels, and family history—play a role in determining whether a child is at risk for weight-related health issues.
It’s also important to remember that the categories are based on population averages, not individual health. A child at the 90th percentile isn’t automatically “unhealthy,” just as a child at the 10th percentile isn’t automatically “healthy.” The categories are meant to flag potential risks, not to label your child. For example, a child with a high BMI but normal blood pressure and cholesterol levels may not need any intervention at all. On the other hand, a child with a “healthy” BMI but a family history of diabetes might benefit from lifestyle changes to reduce their risk.
Finally, the categories can vary slightly by country. In the UK, for example, the National Health Service (NHS) uses the same percentile cut-offs as the CDC, but they emphasize that the categories are not diagnostic. The NHS also notes that children from certain ethnic backgrounds—like South Asian or Black African—may be at higher risk for weight-related health issues at lower BMI percentiles. This is why it’s important to talk to your pediatrician about what the numbers mean for your child specifically.
Growth charts and how they are built
The CDC’s BMI‑for‑age charts are based on data from national health surveys conducted in the United States between 1963 and 1994, with supplemental data from the NHANES (National Health and Nutrition Examination Survey) collected up to 1994. The WHO growth standards, used in many countries outside the U.S., are derived from a multinational study of children raised in optimal health environments. Both sets of charts are designed to reflect how children *should* grow when given healthy nutrition, healthcare, and living conditions—not just how they *do* grow in a given population.
Both sets of charts present the 5th, 50th (median), and 95th percentiles as smooth curves. The 85th percentile is added by the CDC to flag “overweight” risk. The charts are sex‑specific because boys and girls develop at different rates, especially during puberty. That’s why you must select the correct chart for your child’s gender before reading the percentile. For example, a 12-year-old girl’s growth chart will look different from a 12-year-old boy’s chart because girls typically enter puberty earlier and experience different growth patterns.
When you plot a child’s BMI on the chart, you’re essentially seeing where they sit among their peers. If the plotted point follows the same curve over time, the child is growing proportionally. A sudden jump off the curve suggests a change in body composition, which may warrant a deeper look. For example, if your child’s BMI percentile jumps from the 50th to the 75th in six months, it might be a sign that they’ve gained weight faster than their height has increased. This could be due to a growth spurt, a change in activity level, or a shift in diet—but it’s worth discussing with your pediatrician to rule out any underlying issues.
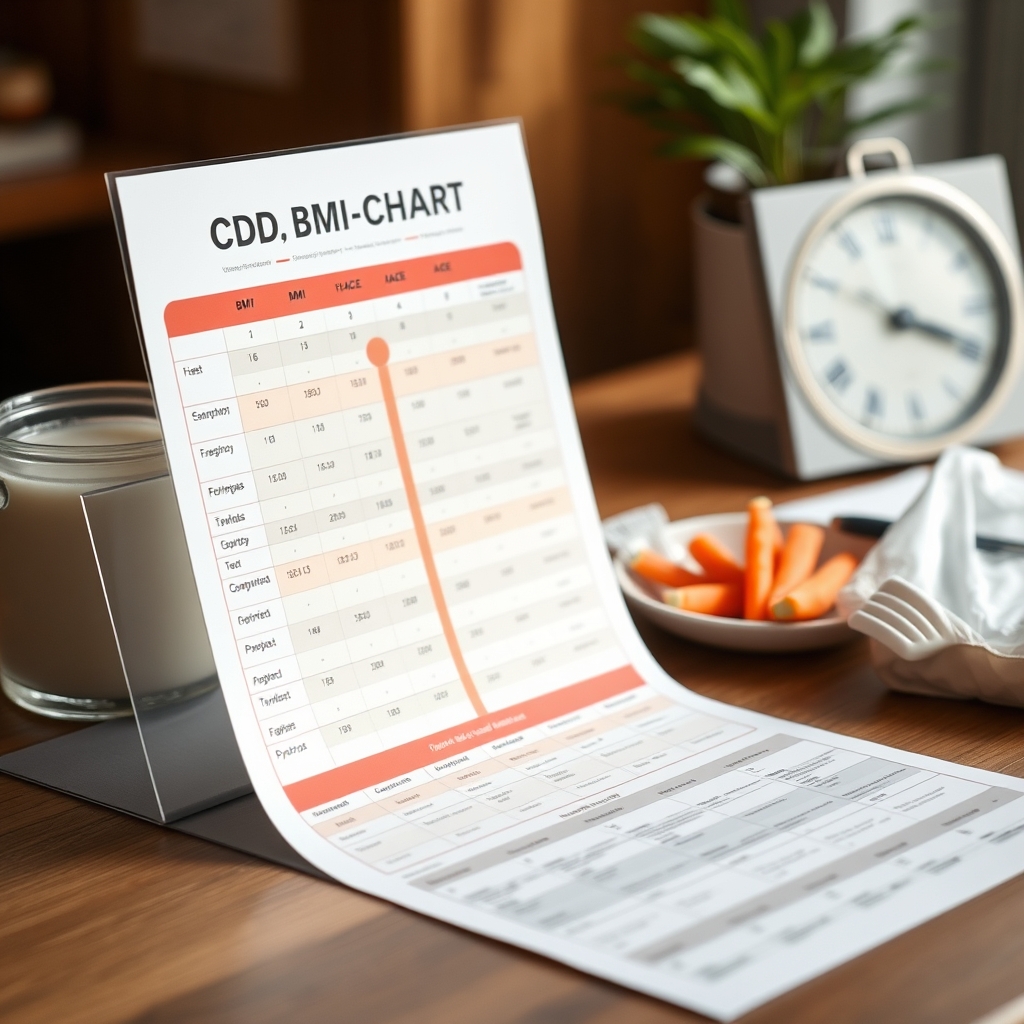
The CDC chart helps translate a raw BMI number into a percentile.
Both CDC and WHO charts are freely downloadable as PDFs. Many pediatricians keep a laminated copy in the exam room for quick reference, and parents can print a personal copy for home use. Remember to use the chart that matches the measurement system (metric vs. imperial) you’re comfortable with. If you’re using the CDC charts, you can also find versions that include the 3rd and 97th percentiles for more detailed tracking. These extra percentiles can be helpful if your child is at the very low or very high end of the growth curve.
One thing to keep in mind is that the growth charts are based on a reference population, not an ideal. The CDC charts, for example, reflect the growth patterns of U.S. children in the late 20th century, when childhood obesity rates were lower than they are today. This means that a child who is at the 50th percentile on the CDC chart may actually be heavier than average compared to today’s children. That’s why some experts argue that the charts should be updated to reflect current growth patterns. However, for now, the CDC and WHO charts remain the gold standard for pediatric growth assessment.
Factors that influence a child's BMI percentile
While the percentile tells you where a child stands relative to peers, it doesn’t explain why they are there. A variety of factors can push the number up or down, and understanding these can help you make sense of the results.
Genetics. Children of parents with higher BMIs are more likely to fall into higher percentiles, independent of diet. This doesn’t mean that genetics determine destiny—it just means that some children may need to work harder to maintain a healthy weight. For example, a child with two parents who have obesity may be more likely to have a higher BMI percentile, but that doesn’t mean they’re destined to have weight-related health issues. Lifestyle factors like diet and activity still play a major role.
Dietary patterns. Frequent consumption of sugary drinks, processed snacks, and large portion sizes can increase caloric intake, while a diet rich in fruits, vegetables, whole grains, and lean proteins supports a healthy weight. But it’s not just about what your child eats—it’s also about how they eat. For example, eating meals together as a family, limiting distractions during meals, and encouraging mindful eating can all help children develop a healthy relationship with food. The American Academy of Pediatrics (AAP) recommends that parents focus on offering a variety of nutrient-dense foods and letting children decide how much to eat. This approach helps children learn to listen to their hunger and fullness cues, which is key to maintaining a healthy weight over time.
Physical activity. The CDC recommends at least 60 minutes of moderate‑to‑vigorous activity each day for kids aged 6‑17. Sedentary time—especially screen time—correlates with higher BMI percentiles. But physical activity isn’t just about structured exercise—it’s also about play. Encouraging your child to run, jump, climb, and explore can help them build strength, endurance, and coordination while also supporting a healthy weight. The AAP notes that even small increases in activity can make a big difference. For example, taking a family walk after dinner or playing a game of tag in the backyard can help your child meet their daily activity goals.
Puberty timing. Early or late onset of puberty can temporarily alter body composition. A child who matures early may gain more muscle and fat, shifting the percentile. For example, girls who start puberty early may see a rapid increase in BMI percentile as their bodies prepare for menstruation. This is a normal part of development, but it can be confusing for parents who see the number jump suddenly. The key is to look at the trend over time, not just a single measurement. If the percentile stabilizes after puberty, it’s likely not a cause for concern.
Socioeconomic environment. Access to safe play spaces, fresh foods, and health education varies by community, influencing weight trends. For example, children who live in neighborhoods with limited access to parks or grocery stores may have fewer opportunities for physical activity and healthy eating. This can contribute to higher BMI percentiles over time. On the other hand, children who grow up in communities with strong support for healthy lifestyles—like school-based nutrition programs or safe walking paths—may have lower BMI percentiles. Addressing these environmental factors is a key part of supporting healthy growth for all children.
Medical conditions and medications. Certain endocrine disorders (e.g., hypothyroidism) and medications (e.g., corticosteroids) can affect weight independent of lifestyle. For example, children with hypothyroidism may gain weight more easily because their metabolism is slower. Similarly, children who take corticosteroids for conditions like asthma or autoimmune disorders may experience weight gain as a side effect. If your child has a medical condition or takes medication, it’s important to discuss how these factors might affect their growth with your pediatrician.
Because these factors intertwine, a single BMI reading should be viewed as a snapshot, not a verdict. For example, a child who just returned from a summer camp where meals were high in carbs may temporarily jump a few percentile points, but that change often stabilizes once routine resumes. Similarly, a child who is recovering from an illness may lose weight and drop in percentile, but they’ll likely catch up once they’re feeling better. The key is to look at the trend over time, not just a single measurement.
Understanding the “why” behind the number helps you tailor interventions—whether it’s a simple tweak in snack choices, adding a family walk, or seeking a medical evaluation for an underlying condition. For example, if your child’s BMI percentile has been slowly increasing, you might focus on reducing sugary drinks and increasing active play. If the percentile has dropped suddenly, you might look for signs of illness or changes in appetite. Either way, the goal is to support your child’s overall health, not just their weight.
How to track growth trends over time
One of the most important things you can do as a parent is to track your child’s growth over time. A single BMI percentile tells you where your child stands today, but the trend over months or years tells you whether their growth is stable, accelerating, or slowing down. This is why pediatricians plot growth at every well-child visit—it’s the pattern, not the single point, that matters most.
To track growth at home, start by recording your child’s height, weight, and BMI percentile at regular intervals. For younger children (ages 2–5), measuring every 3–6 months is usually enough. For older children and teens, measuring every 6–12 months is sufficient unless you have specific concerns. You can use a simple spreadsheet or a notebook to log the measurements, or you can use an online tool like the Child BMI Calculator to save and track results over time.
When you look at the trend, ask yourself: Is the percentile staying roughly the same, or is it moving up or down? A stable percentile—even if it’s at the high or low end of the range—is usually a sign of healthy growth. For example, a child who is consistently at the 90th percentile is growing proportionally, even if they’re heavier than most of their peers. On the other hand, a child whose percentile is steadily increasing or decreasing may need further evaluation. For example, a child who moves from the 50th to the 75th percentile over a year might benefit from a closer look at their diet and activity levels.
It’s also helpful to plot the measurements on a growth chart. This gives you a visual way to see the trend. If the points follow the same curve over time, your child is growing consistently. If the points jump suddenly off the curve, it might be a sign that something has changed—like a new activity level, a shift in diet, or an underlying health issue. For example, a child who jumps from the 50th to the 90th percentile in six months might be gaining weight faster than their height is increasing. This could be due to a growth spurt, but it’s worth discussing with your pediatrician to rule out any other factors.
When you visit the pediatrician, bring your growth log with you. This can help the doctor see the trend over time and make more informed recommendations. For example, if your child’s BMI percentile has been slowly increasing, the doctor might suggest small changes to their diet or activity level. If the percentile has dropped suddenly, the doctor might look for signs of illness or changes in appetite. Either way, having a record of your child’s growth can make the conversation more productive.
Finally, remember that growth trends can vary widely from child to child. Some children grow steadily, while others have periods of rapid growth followed by plateaus. Some children are naturally lean, while others are naturally stocky. The key is to look at your child’s overall health and well-being, not just the number on the chart. If your child is active, energetic, and eating a variety of foods, they’re likely growing just fine—even if their BMI percentile isn’t “average.”
Tracking growth over time helps you spot trends and discuss them with your pediatrician.
How to talk to your child about weight in a positive way
If your child’s BMI percentile falls outside the healthy range, it’s natural to feel concerned. But how you talk about weight can have a big impact on your child’s self-esteem and relationship with food. The goal is to focus on health, not appearance, and to involve your child in the conversation in a way that feels supportive, not critical.
First, avoid using words like “fat,” “skinny,” “diet,” or “weight loss” around your child. These terms can create negative associations with food and body image, especially for younger children. Instead, focus on behaviors that support health, like eating more fruits and vegetables, drinking water instead of soda, or playing outside more often. For example, you might say, “Let’s try to eat more colorful foods this week—it’ll help you feel strong and energized!” instead of “You need to lose weight.”
Second, involve your child in the process. Ask them what kinds of physical activities they enjoy, and encourage them to try new ones. Let them help plan and prepare meals, and talk about how different foods make them feel. For example, you might say, “How does your body feel after you eat a big bowl of fruit? Does it give you energy for playing?” This helps children connect their food choices to how they feel, rather than to how they look.
Third, be mindful of your own attitudes about weight and body image. Children pick up on the messages we send, even if we don’t say them out loud. If you’re constantly talking about your own weight or dieting, your child may start to see food and exercise as something to fear or control, rather than something to enjoy. Instead, model a positive relationship with food and activity. Eat meals together as a family, try new foods, and make physical activity a fun part of your daily routine.
Fourth, avoid comparing your child to others. Every child grows at their own pace, and comparing them to siblings, friends, or classmates can create unnecessary stress. Instead, focus on your child’s individual progress. For example, you might say, “I’ve noticed you’ve been running faster lately—your hard work is paying off!” instead of “Why can’t you run as fast as your friend?”
Finally, if you’re concerned about your child’s weight, talk to your pediatrician before making any changes. They can help you determine whether your child’s growth is on track and recommend evidence-based strategies for supporting their health. They can also help you address any underlying issues, like emotional eating or disordered eating patterns, that might be contributing to the problem.
Remember, the goal is to help your child develop a healthy relationship with food and activity that will last a lifetime. That means focusing on habits, not numbers, and supporting your child’s overall well-being, not just their weight.
Next steps if the percentile falls outside the healthy range
Discovering that your child’s BMI is in the underweight or overweight category can be unsettling, but it’s also an opportunity to act early. Here are practical steps you can take, organized by the direction of the concern.
If the percentile is below the 5th (underweight)
Schedule a pediatric visit. The doctor will assess growth patterns, dietary intake, and possible medical causes. They may also check for signs of nutrient deficiencies, like low iron or vitamin D levels, which can affect growth and energy levels. If your child has a chronic illness or digestive issues, the doctor may refer you to a specialist for further evaluation.
Boost calorie density. Offer nutrient‑rich snacks like nut butter on toast, full‑fat yogurt, or avocado smoothies. You can also add healthy fats to meals, like olive oil on vegetables or cheese on whole-grain crackers. For younger children, try offering smaller, more frequent meals and snacks to ensure they’re getting enough calories throughout the day.
Encourage regular meals. Structured meal and snack times help ensure consistent energy intake. Try to offer meals and snacks at the same times each day, and avoid letting your child graze throughout the day. This helps them build a healthy appetite and ensures they’re getting a variety of nutrients. If your child is a picky eater, try offering new foods alongside familiar favorites, and don’t force them to eat if they’re not hungry.
Monitor activity. While play is essential, very high‑energy activities may increase calorie needs. If your child is very active, they may need more frequent snacks or larger portions to keep up with their energy demands. For example, a child who plays sports may need a snack before and after practice to ensure they’re getting enough calories. On the other hand, if your child is less active, they may need fewer calories, so it’s important to adjust portion sizes accordingly.
If the percentile is between the 85th and 94th (overweight)
Family‑wide nutrition changes. Swap sugary drinks for water, introduce more fruits and vegetables, and reduce portion sizes for the whole household. The AAP recommends that families focus on making small, sustainable changes, like adding one extra serving of vegetables to dinner or replacing soda with sparkling water. These changes can add up over time and help your child develop healthier eating habits. It’s also important to model healthy eating behaviors—if your child sees you eating a variety of foods and enjoying them, they’re more likely to do the same.
Increase active play. Aim for at least an hour of movement per day—bike rides, soccer, dancing, or even a backyard obstacle course. The key is to make physical activity fun and engaging. For example, you might turn a family walk into a scavenger hunt or sign your child up for a dance class or sports team. The AAP notes that even small increases in activity can make a big difference in supporting a healthy weight. For example, taking the stairs instead of the elevator or walking to school instead of driving can help your child meet their daily activity goals.
Limit screen time. The American Academy of Pediatrics suggests no more than 2 hours of recreational screen time per day for kids 6‑18. This includes time spent watching TV, playing video games, or using a tablet or smartphone. Excessive screen time is linked to higher BMI percentiles, so setting limits can help support a healthy weight. Try to create screen-free zones, like the dinner table or bedrooms, and encourage other activities, like reading, playing outside, or doing crafts.
Track progress. Keep a simple log of height, weight, and activity to see trends over months rather than weeks. This can help you and your pediatrician spot patterns and make adjustments as needed. For example, if your child’s BMI percentile is slowly increasing, you might focus on reducing sugary drinks and increasing active play. If the percentile is stable, you might focus on maintaining healthy habits. Either way, tracking progress can help you stay motivated and make informed decisions about your child’s health.
If the percentile is 95th or higher (obesity)
Consult a pediatric specialist. A dietitian or pediatric obesity clinic can create a personalized plan that respects your child’s cultural foods and preferences. They can also help you address any underlying issues, like emotional eating or disordered eating patterns, that might be contributing to the problem. The AAP recommends that children with obesity be evaluated for related health issues, like high blood pressure or high cholesterol, and that families work with a healthcare team to develop a comprehensive treatment plan.
Set realistic goals. Focus on small, sustainable changes—like adding a vegetable to each dinner—instead of drastic dieting. The goal is to help your child develop healthy habits that will last a lifetime, not to achieve a specific weight or BMI percentile. For example, you might start by focusing on one meal or snack at a time, like replacing soda with water at lunch or adding a serving of fruit to breakfast. Over time, these small changes can add up to big results.
Address emotional well‑being. Children with higher BMIs may face teasing; supportive communication and confidence‑building activities are crucial. The AAP notes that children with obesity are at higher risk for depression, anxiety, and low self-esteem, so it’s important to address these issues as part of the treatment plan. Encourage your child to talk about their feelings, and help them find activities they enjoy and excel at. For example, if your child loves art, you might sign them up for an art class or encourage them to create a vision board
🔢 Ready to crunch your numbers? Use our Child BMI Calculator for a personalized result in seconds.
When Shubhra Mishra was expecting her first child in 2016, she was overwhelmed by conflicting food advice — one site said yes, another said never. By the time her second baby arrived in 2019, she realized millions of mothers face the same confusion.
That sparked a five-year journey through clinical nutrition papers, cultural diets, and expert conversations — all leading to BumpBites: a calm, compassionate space where science meets everyday motherhood.
Her long-term vision is to build a global community ensuring safe, supported, and free deliveriesfor every mother — because no woman should face pregnancy alone or uninformed. 🌿
🌍 Stand with mothers, shape safer guidance
Join a small circle of experts who review BumpBites articles so expecting parents everywhere can decide with confidence.